Objective
The objective of this project is to digitize and archive in a PDS-compliant fashion the imaging data from the Surveyor lunar landers. Currently, surviving copies of the data are stored on 70mm film in three Regional Planetary Imaging Facilities and at NSSDC. Data are practically inaccessible to planetary scientists and the public because they may not be checked out.
Introduction
Within a remarkable 1.5-year period (May 1966 to January 1968), NASA’s Surveyor Program successfully landed no fewer than five spacecraft (Surveyor 1,3,5,6,7) on the surface of the Moon (Table 1). The Surveyor Program was primarily intended as safety and technology tests for Apollo, including assessment of soil mechanical properties and suitability for landing. However, these spacecraft also carried vidicon imaging systems with color filters (polarizing filters replaced the color filters on Surveyor VI and VII), which were used to document their surroundings; they returned over 87,000 images at resolutions of up to 1mm, increasing our understanding of the lunar surface. Other investigations included alpha-particle scattering detectors to characterize surface chemistry (on Surveyors V, VI and VII) and soil mechanics experiments (on Surveyors III and VII) to evaluate surface bearing, shear strength and cohesion, etc. The Surveyor imaging data documented for the first time surface conditions on the Moon and over time have provided invaluable information for lunar exploration on local lunar landing site properties, including soil particle size, density and strength, presence and distribution of pebbles, cobbles and boulders, characteristics of impact craters and their ejecta, local and regional slopes and their frequency and distribution (e.g., Jaffe et al., 1969, 1970; Shoemaker et al., 1969). In part because of the relatively few landing sites across the lunar near side, these image data and derived information are still being used to support lunar science and exploration (e.g., Wagner, 2006). The Surveyor Program imaging data therefore represent an invaluable lunar science and engineering resource that warrant restoration so that they are both preserved and made available for future generations of researchers.
This ‘data restoration’ proposal to the NASA LASER Program directly addresses that need.
| Spacecraft | Longitude | Latitude | Touchdown | Last Data Return |
|---|---|---|---|---|
| I | 316.7 E | 2.5 S | 6/2/1966 | 1/7/1967 |
| III | 336.7 E | 3.1 S | 4/20/1967 | 5/4/1967 |
| V | 23.2 E | 1.4 N | 9/11/1967 | 12/17/1967 |
| VI | 358.6 E | 0.5 N | 11/10/1967 | 12/14/1967 |
| VII | 348.6 E | 41.0 S | 1/10/1968 | 2/21/1968 |
Table 1. Locations and times of Surveyor missions (Jaffe and Steinbacher, 1969).
Surveyor II and IV were lost during a mid-course correction and a landing sequence respectively. Impressively, Surveyor I landed safely despite the absence of orbital imagery of the landing site. 1.1.2 Overview of Surveyor Program Imaging Data Several types of imaging sequences (Table 2) were performed by the Surveyor Cameras. Narrow and wide field settings supported completion of full panoramic Digitization and Public Archiving of the Surveyor Imaging Dataset 2 imaging sequences of the landing sites (e.g., Fig. 1). Images of some scenes at multiple phase angles over the lunar day allowed for photometric studies and detailed characterization of soil properties. The nature of lunar soil was uncertain prior to Surveyor (Gold, 1962), and the imaging and geophysical data collected during these missions helped to determine whether the lunar surface could sustain landing of spacecraft. The camera supported the other instruments by photographing the surface excavations and the site of the alpha-particle scattering detector. The Surveyor team devoted smaller numbers of images to observe the Earth, star-fields, and a solar eclipse. Table 2 is reproduced from Shoemaker et al. (1969) and lists numbers of images devoted to each of these categories for each of the missions.
Surveyors I, V and VII were reactivated and operated in a second lunar day (albeit after a lengthy warmup period) and Surveyor V lasted into a third lunar day. Surveyor VI is unusual in that the descent engines were fired during the landed mission allowing the spacecraft to ‘hop’ laterally 2.4m (potentially allowing stereo topography to be generated from the pre- and post-hop images). In total, Shoemaker et al. (1969) notes that 87,396 lunar images were acquired over all stages of the Surveyor Program. Images are denoted by mission number (sometimes lettered A-G) and by day of year and GMT time of acquisition.
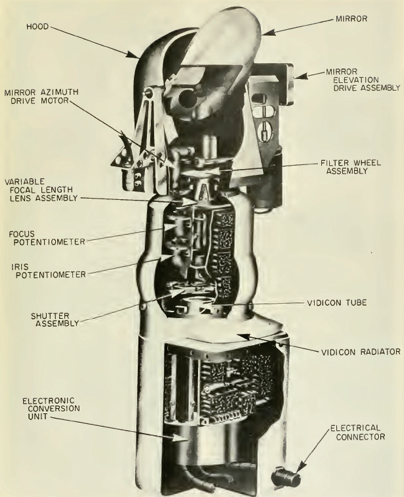
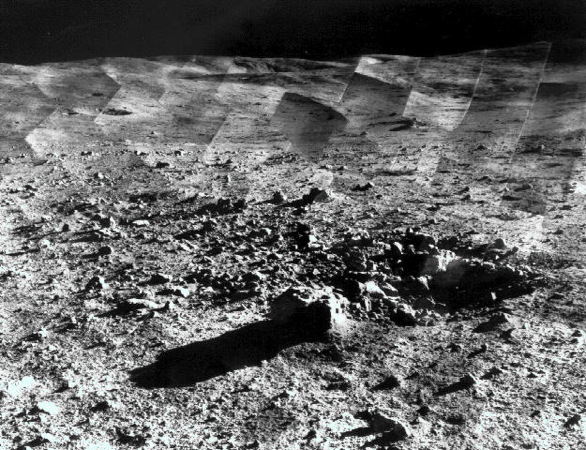
Figure 1. (left) Schematic of Surveyor I camera design (Jaffe and Steinbacher, 1969). (right) Narrow-angle panorama constructed from Surveyor VII images.
The cameras were designed (Fig. 1) to allow imaging in a wide range of illumination conditions. The focal length of the camera could be varied from 25 to 100mm, resulting in optical fields of view of about 25.3° to 6.43°; however, the camera was always operated at either the 25- or 100-mm focal length. An adjustable iris allowed the aperture to vary from f4 to f22 in response to varying scene brightness. Images were acquired in either 200- or 600-line mode for transmission to Earth. Camera orientation was controlled by elevation and azimuth stops, which resulted in coverage from 65° below the camera horizontal to the horizon and over azimuths of 132° counterclockwise and 225° clockwise, i.e., only 3° of azimuth was unobservable although concerns about the camera mechanism sticking to the stops meant this full range was not utilized on every mission.
The Dataset
Number of Images per Mission:
- Surveyor I 11,240
- Surveyor III 6,326
- Surveyor V 19,006
- Surveyor VI 29,952
- Surveyor VII 21,083
Total: 87,607
During the scanning process, we discovered that many rolls also contained test patterns, focus charts, resolution and calibration images. The final count of images scanned was over 92,000.
History of the Surveyor Landing Dataset
In 2012, four original co-investigators for the Surveyor Lander Television Experiment wrote a letter seeking financial support for digitizing over the 87,674 images to yield further research and preserve the entire dataset. They were Ray Batson, USGS, Henry Holt, USGS, Ewen Whitaker, UA/LPL, and Justin Rennilson, CalTech/JPL. The letter was presented at the annual RPIF executive meeting on November 28, 2012, in the Ron Greeley Center for Planetary Science at Arizona State University, Tempe. It was suggested by Michael Kelley (NASA) that a proposal to NASA be submitted for grant funding to support the digitization of the data set. After the meeting concluded Dr. Shane Byrne director of the Regional Planetary Image Facility at the Lunar and Planetary Laboratory of UA said he would write such a proposal. On February 28, 2013, the proposal was submitted to NASA via the LASER program, and on April 9, 2014, the grant was approved for funding. In 2015 the digitization began in the Lunar and Planetary Laboratory on the 5th floor of the Kuiper Space Science Building on the UA campus. The equipment was rented from Stokes Imaging Inc. in Thorndale TX and housed in a portable clean room.
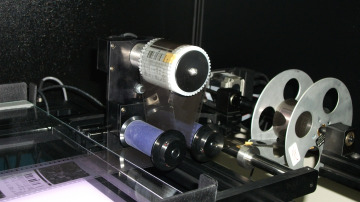
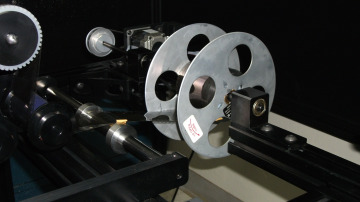
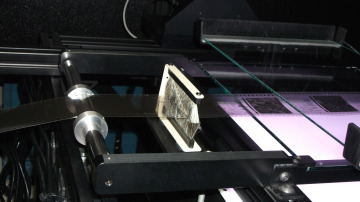
The apparatus used for digitizing the images was computer-controlled. It had an arm for taking 70 mm film from 7-inch diameter reels and passing the film over an LED light source underneath a glass plate, which would automatically raise and lower during transit. A high-resolution camera took a photograph of the entire frame. A stepper motor then pulled the film onto a take-up roll. Control for these steps utilized software that would allow the operator to either skip an image or duplicate it. The 70 mm film image frame consists of a raw image measuring 48 mm square and a section containing all the metadata associated with that image. The metadata consisted of human-readable text; a binary code; and a bar code with all parameters of the image. The frame size was set by two dots in the middle of the frame separated by 4 inches.
A Microsoft Excel spreadsheet of 28 columns contains all the parameters of the image. During the missions, the use of the camera was recorded on an operations log (ops log). The 9 columns on the log are from, left to right: Track pass; the number times the spacecraft passed over the DSN antenna; the DSN station ID; a survey # of the preformatted control tape; description of the activity when the camera was used; the film roll and file # (image ID) of the beginning of the activity; the GMT of start of that the activity; the end image ID of that activity; and the GMT of that activity.
The five successful missions were divided into two phases, engineering and science. Control of the first phase was by the system engineering team and the latter by the space science analysis command (SSAC). Upon landing the omni antenna was used to transmit the first images (200 line resolution) and when the planer array was directed to Earth, switched to 600 line resolution. A wide-angle survey was completed and then narrow-angle surveys composed of 19 sectors (18° azimuths) would be performed. These 19 sectors could be grouped into 5 segments. All survey commands were sent to the camera from preprogrammed paper tape without operator involvement. The activity column identifies these sectors and segments. Using the ops log and the image ID (roll/file) columns these images can be used to make mosaics and panoramas.
In the late 1960s and early 1970s, television data for three of the Surveyor missions: Surveyor 1, 3, and 5 was documented by the U.S. Geological Survey for NASA and released in three catalogs: Catalog of Surveyor 1 Television Pictures (NSSDC 68-10, 1968), Surveyor 3 Mission Report Part 3 - Television data (NASA-CR-95875, 1967), and Atlas of Surveyor 5 Television Data (NASA SP-341, 1974). Each catalog contains individual frame data, which was scanned and utilized to populate columns throughout the spreadsheet. Several thousand scanned frames, such as those captured by Surveyor missions 1 and 3 do not contain correlating metadata next to their cropped image, therefore the scanned catalogs are of great value in providing the televised metadata for each frame. To identify any discrepancies, the metadata present on individual scanned frames can be compared to the televised metadata located in each catalog. Aside from image metadata, improved mosaics of panoramas, used to investigate details of the lunar surface, are also shown throughout the catalogs.
The Scanning Process
Microsoft Excel Spreadsheets
Surveyor 1: /sites/sic.lpl.arizona.edu/files/surveyor/Surveyor-1-Columns-Feb-2025.xlsx
Surveyor 3: /sites/sic.lpl.arizona.edu/files/surveyor/Surveyor-3-Columns-Feb-2025.xlsx
Surveyor 5: /sites/sic.lpl.arizona.edu/files/surveyor/Surveyor-5-Columns-Feb-2025.xlsx
Surveyor 6: /sites/sic.lpl.arizona.edu/files/surveyor/Surveyor-6-Columns-Feb-2025.xlsx
Surveyor 7: /sites/sic.lpl.arizona.edu/files/surveyor/Surveyor-7-Columns-Feb-2025.xlsx
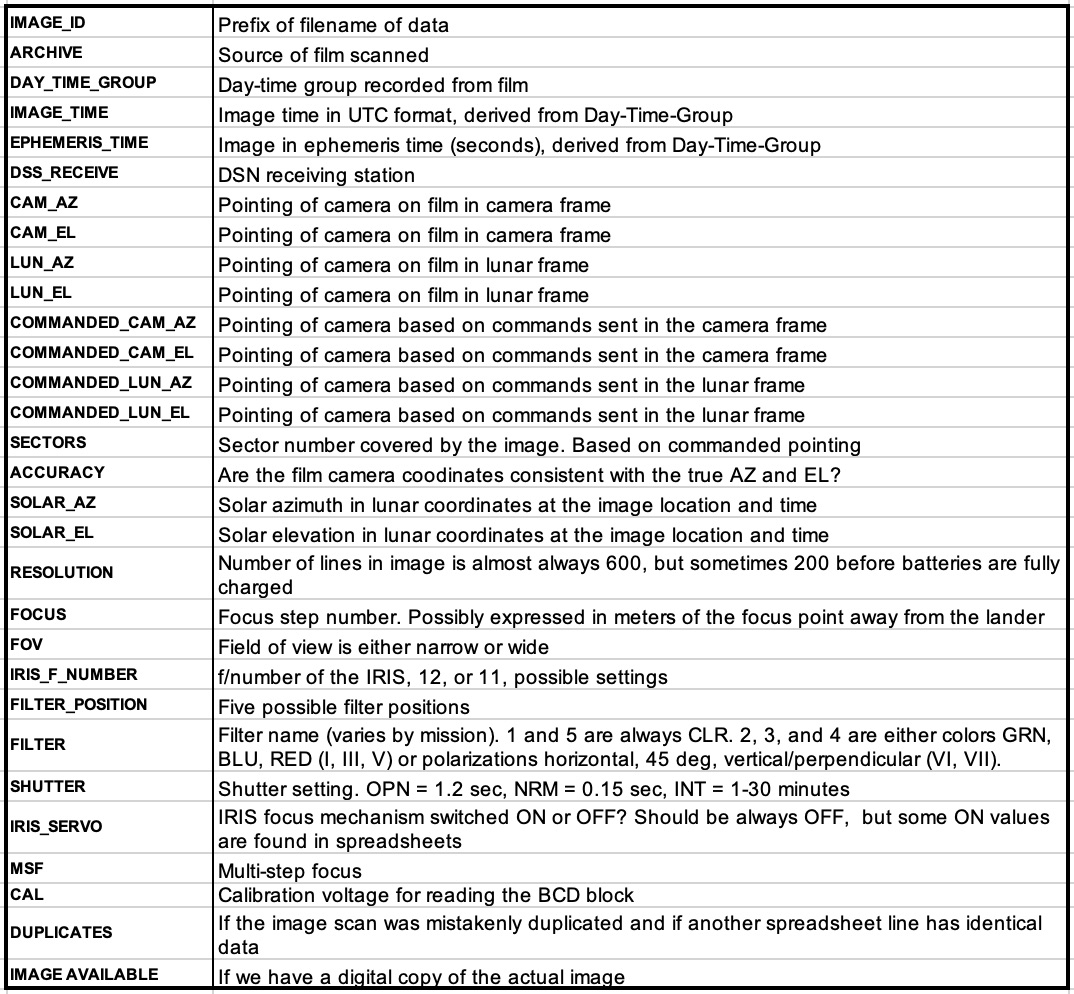
Microsoft Excel Spreadsheets: Column Headings & Meanings